


The HyperReal-Estate Decline
The HyperReal-Estate Decline
6th Sense Musings in the 5th Estate on the 7th Day


What is ‘real’?
What is ‘fake’?
In an inverted world - this question is not so simple to answer.
Let’s introduce a concept:
Hyperreality: Proposed by Jean Baudrillard, the concept of hyperreality captures the inability of consciousness to distinguish reality from a simulation of reality. This is more prominent in technologically advanced societies.

In real estate, consider the Global Financial Crisis and how a property in Iceland turned into a global contagion. How could something so ‘real’ and ‘safe’ be so interconnected to global credit and bond markets?
What about the COVID pandemic? For sure, one of the safest things was to rely on your properties as the global markets were in panic and fear right?
Who would have thought that the fear would lead to lockdowns which effectively would freeze and alter cap rates - even today.
Why are invisible things so adverse to hard asset and why are hard assets so clearly impacted by the simulation?
“The economy of imaginary wealth is being inevitably replaced by the economy of real and hard assets” Vladimir Putin
As much as Putin would like to annex real and hard assets as his GDP is primarily driven by that. Sanctions suggest there is an entire world he’s just not part of, that investors must participate in - global capital markets.
Global capital markets that can be understood through math.
Blind Read

There is a massive blind spot in the real estate services industry.
Real estate analytics fail to combine the real and financial economy for a deep understanding of trends. A myopic lens with elementary analytics throughout the entire vertical.
This is why the current crash in real estate has caught so many off guard.
We are inundated with a series of economic indicators or policies that appear to be the only focus for real estate prices or real estate stocks.
Analysts and investors are blinded by the hyperrealism of the 'real' estate and discount the financialized world.
Economists and financial analysts are too preoccupied by the imaginary world of 'housing starts' and 'new home sales' to grasp the actual supply.
Fear not, we have taken the liberties to decode the real estate sector for you.
Throughout this write up we will show the structural features of the economy in many sectors - which apply to real estate.
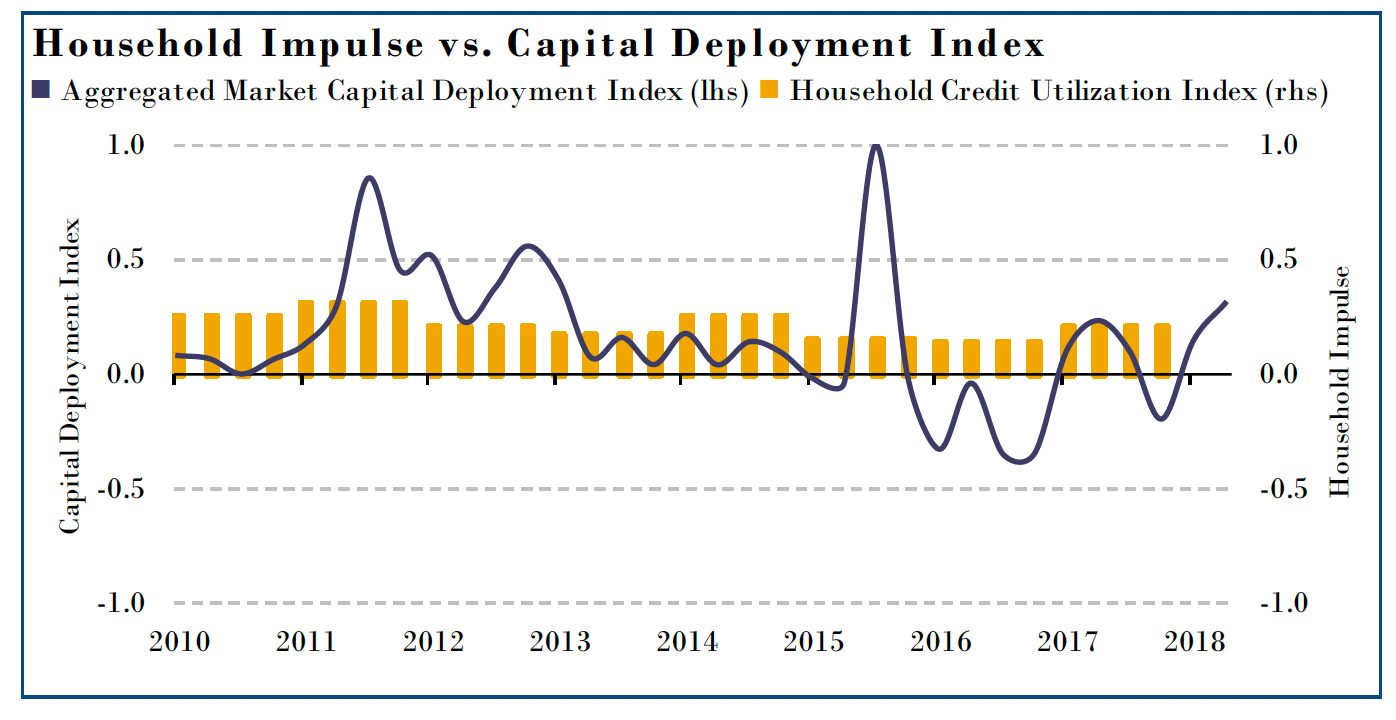
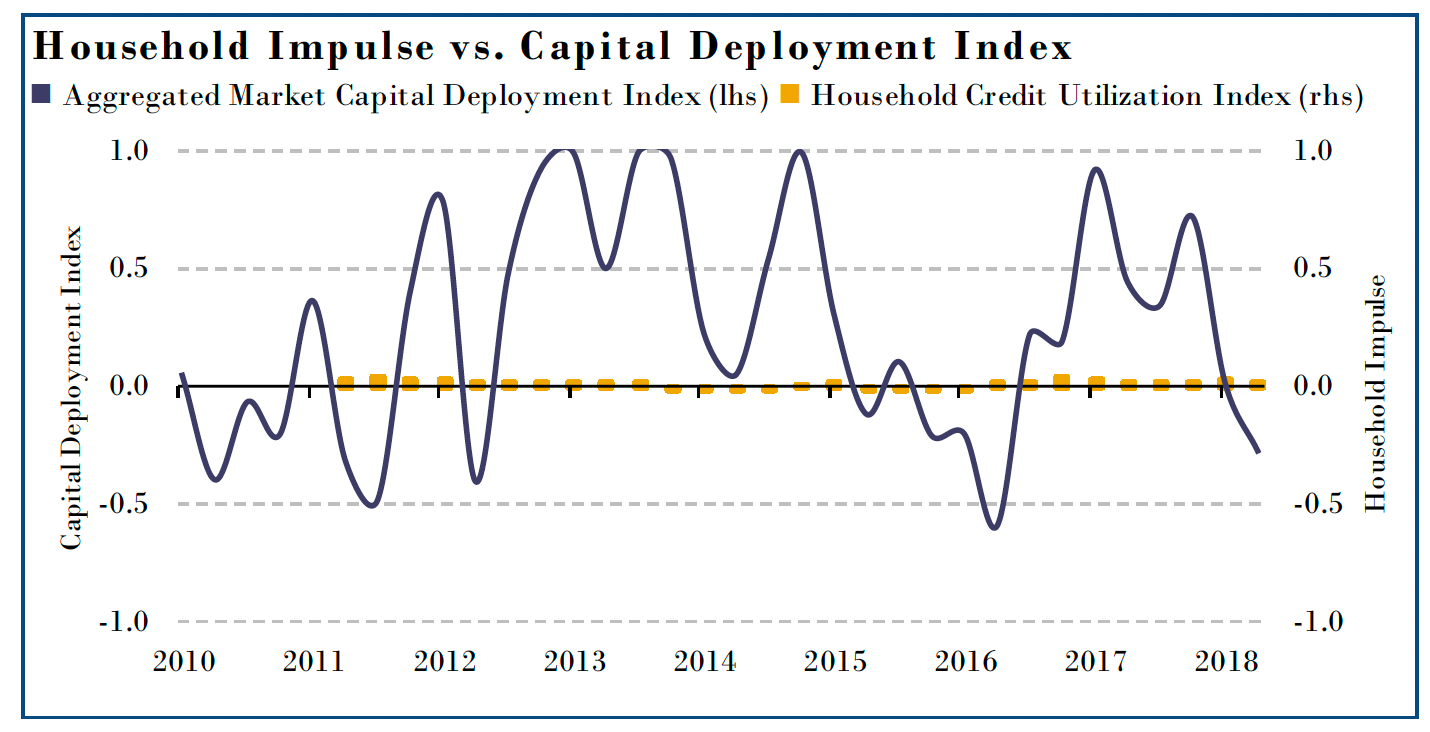
Real Estate Impulse (REI)
Real Estate Impulse (REI) examines the real estate sector in different groups based on positioning in the value chain. It projects real estate market trends and real estate stock prices with - a one to three - year lead time.
We capture real estate through a macro economic and capital market lens. As real estate and infrastructure represent state-sponsored capitalism to the fullest extent. This linkage comes from central banking monetary policy. Monetary policies that coordinate the flow of credit to potential lenders. With lenders facilitating credit flow and equity expansion with their borrowers.
The borrowers base their decisions on real estate prices. With price representing the past, present and future cashflows. A reflection of stimulated demand relative to supply from credit flow.
These variables in confluence are rarely measured to be discussed with precision. When measured with precision - it is the key to unlocking the entire real estate industry. With wide ranging commercial and investment applications.
Check the Impulse: Context - Understanding - Context
1) Monetary Policy: REI starts with the central bank to determine base rates and liquidity for lenders. Along with the rules and regulations for loan requirements. The rise of the dollar was inevitable with global central bank coordination = bearish real estate.
2) Capital Market Signals: REI scans listed banks, lenders and capital markets. To examine stock prices, expansive balance sheets, equity listings, interest rates and bond yields. Many bigger banks open smaller branded mortgage companies to bend the rules on lending limits for real estate. From this we can determine the types of bank loans being issued as well as the amount and types of debt.
*Developers can also use bonds and stocks to issue securities and raise funds, so capital doesn’t always go through banks.
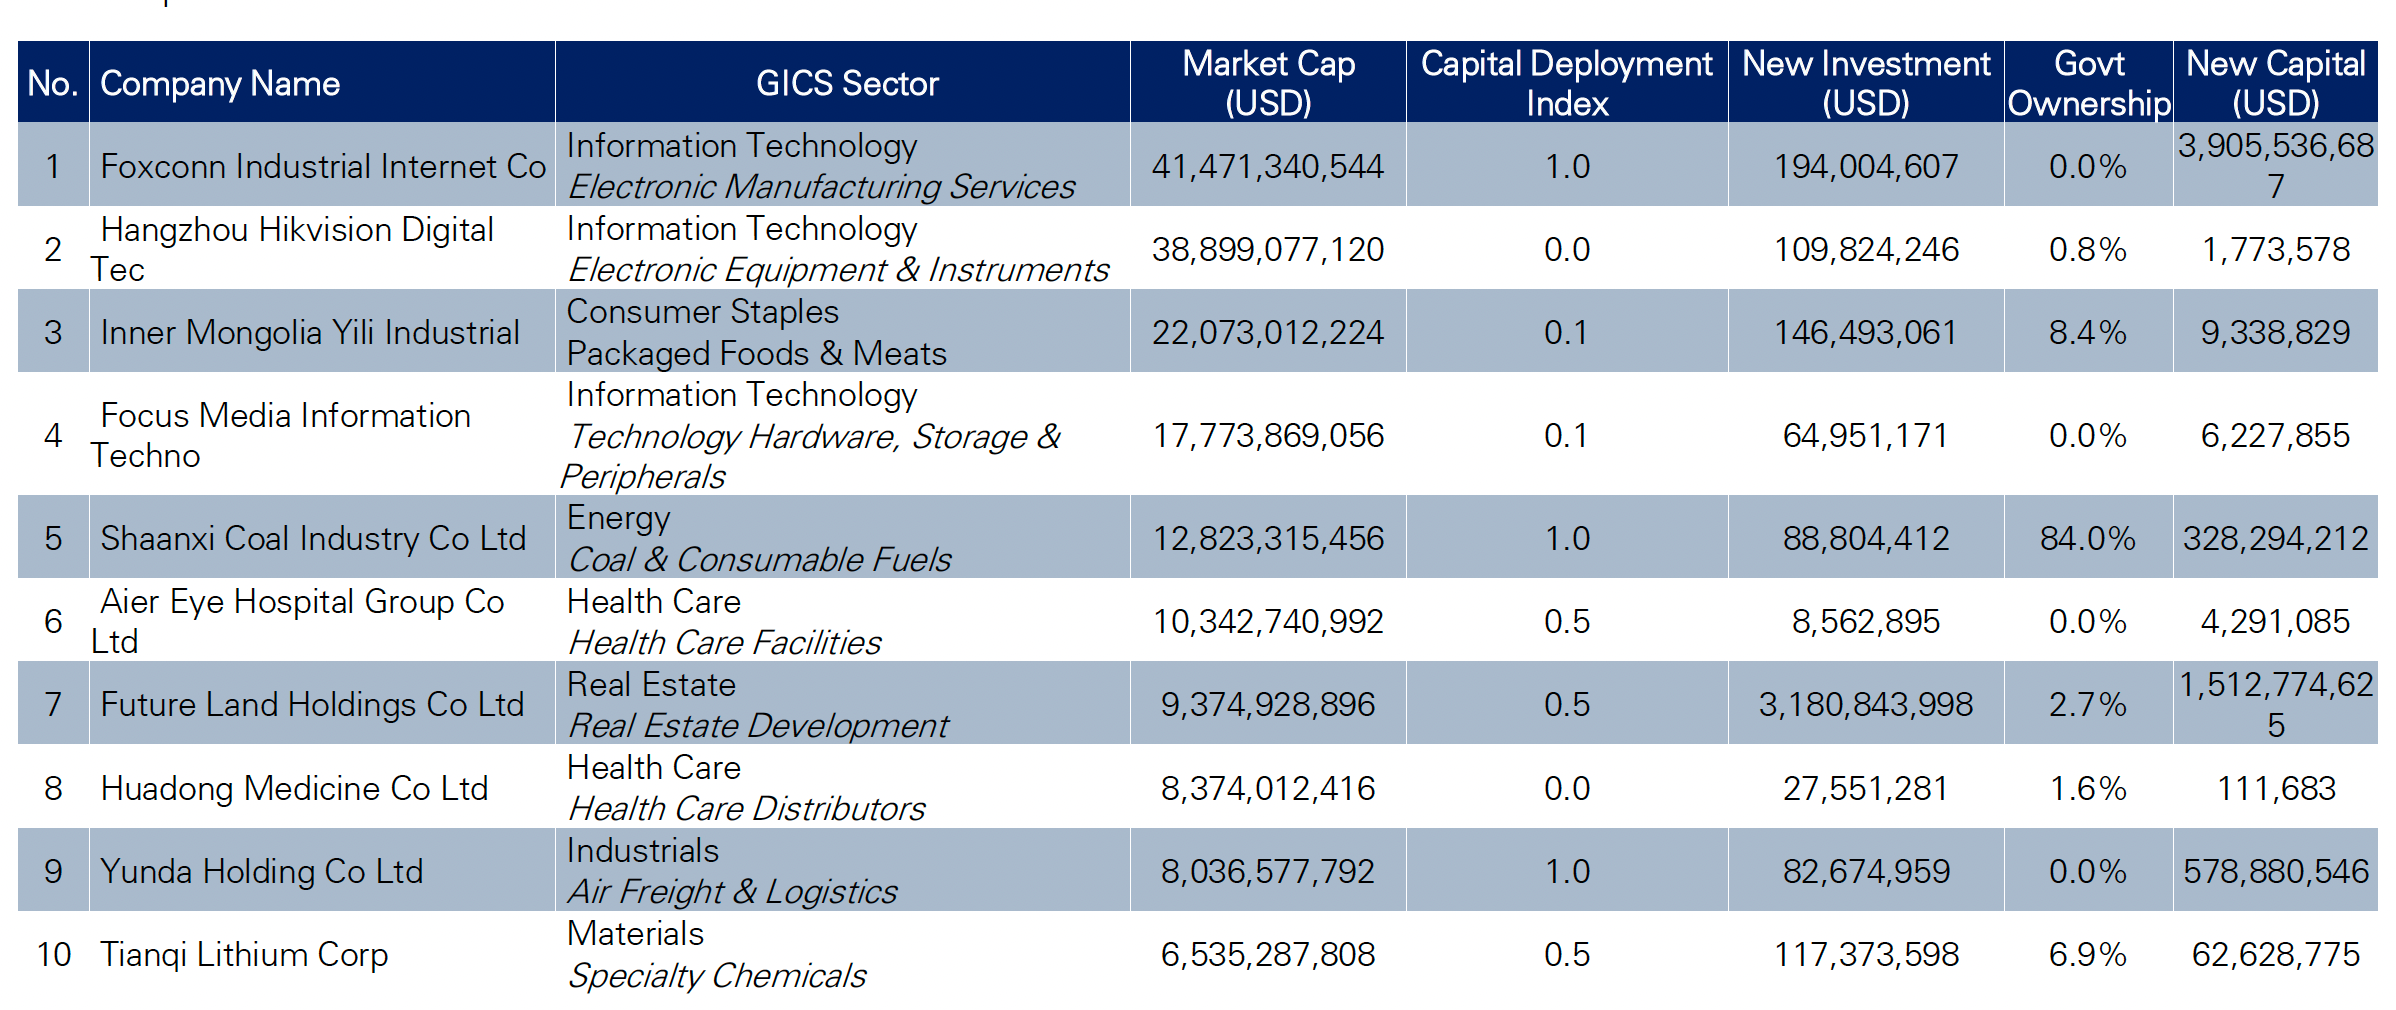
3) Fundamental Analysis: The following stage is to scan real estate suppliers. From major to niche developers, who produce new supply to meet demand, as measured by credit in the market on both supply and demand sides. Credit availability for developers to build new housing projects. And credit availability to commercial and residential buyers is a key indicator for developers when bringing new production online.
Corporate decisions can be broken down into three main stages a) b) c):
a) Capital Deployment: can be measured by figures such as CAPEX to access companies’ outlook on future supply prospect in relation to demand estimates.
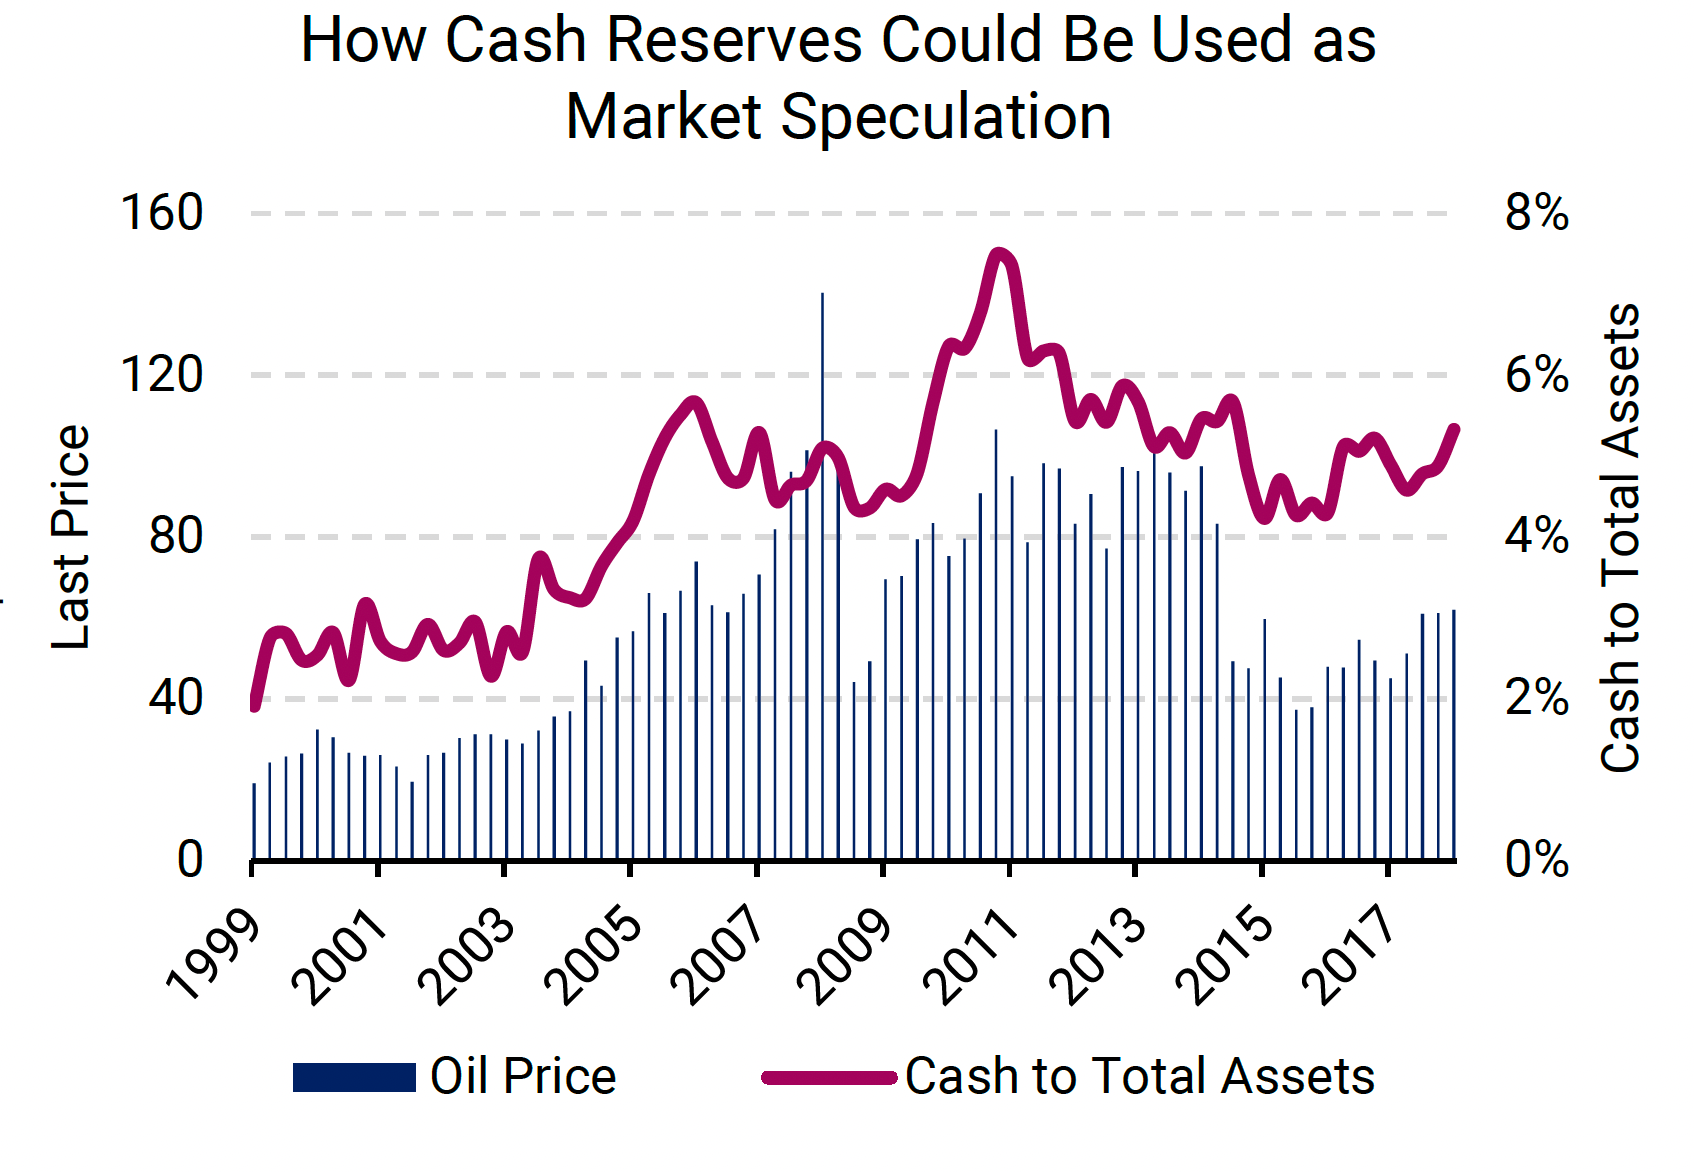
b) Corporate Decisions: can be measured by how companies raise capital using cash reserves or leverage for new investment.
c) Distributions: can be measured by dividend yield as companies with new investment will likely cut back on dividends.
4) Price Analysis: After assessing the credit situation, we can measure all prices in the value chain, from stocks of banks, lenders and developers to real estate itself.

5) Market Elasticity: Real estate prices are a function of supply and demand. Developers function like miners, to only bring new supply into the market. Irrespective of pre-existing real estate. To measure price elasticity, we want to see an influx of demand indicated by credit vs new and upcoming supply. The new supply is measured by activities in the developer market vs all pre-existing real estate. New supply is a plus to GDP, which explains the state-sponsored interests in development and infrastructure projects to bolster GDP.
Demand > Supply = Higher Prices
Supply > Demand = Lower Prices
6) Credit Flows: Important to measure the buyer’s ability to access more credit to meet demand, looking at month/month, year/year, quarter/quarter declines vs total supply. Can further segment analysis into commercial and residential.
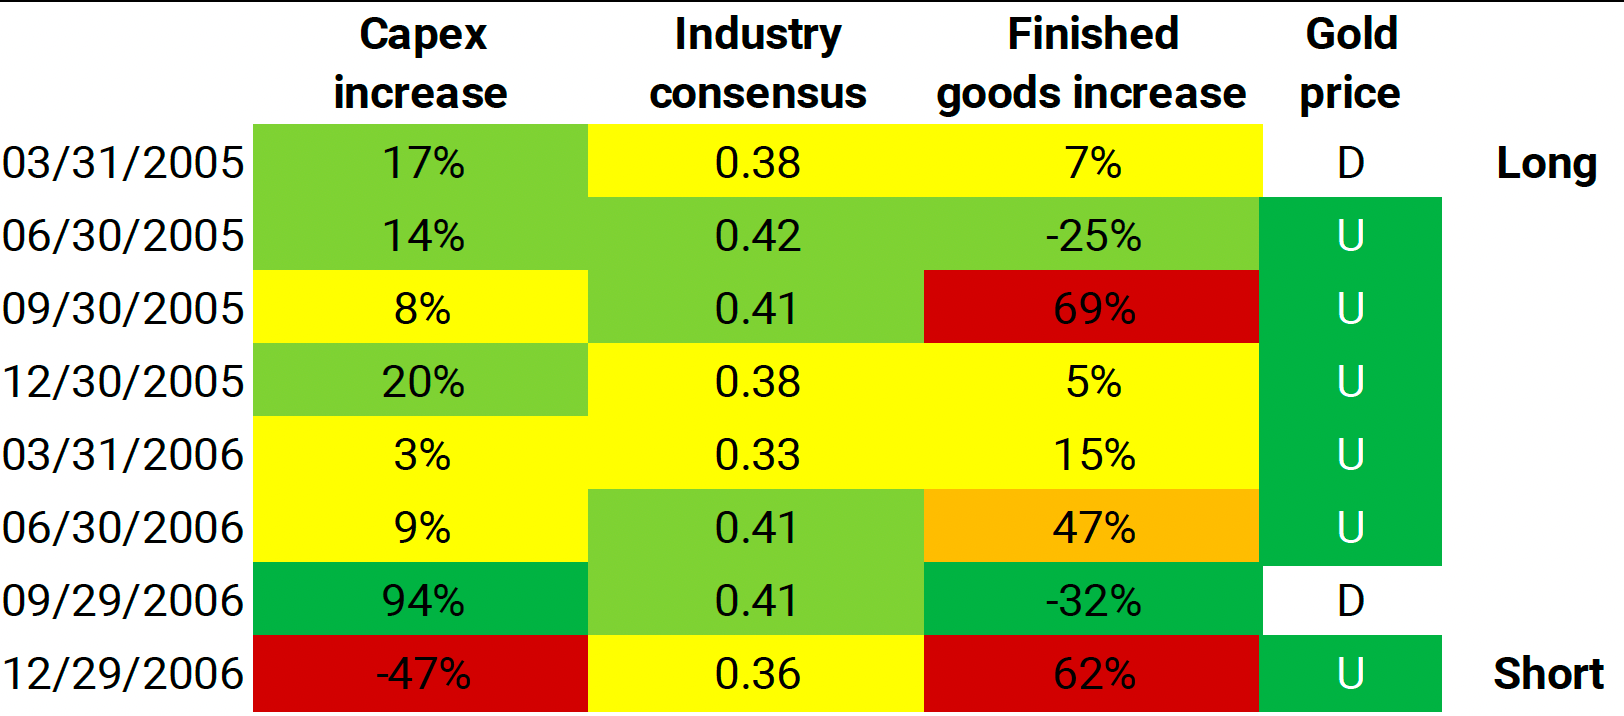
A real estate developer consensus can be a key measure to understand the industry using CAPEX, as in the case of expected demand growth that will likely lead to a high percentage of producers to increase CAPEX in this period.
REI: Top Down - Bottom Up - Vertical Durability
REI is infallible as its methodology is for use in sectors throughout the entire economy. Representing structural features of top down - bottom up economics and financial analysis.
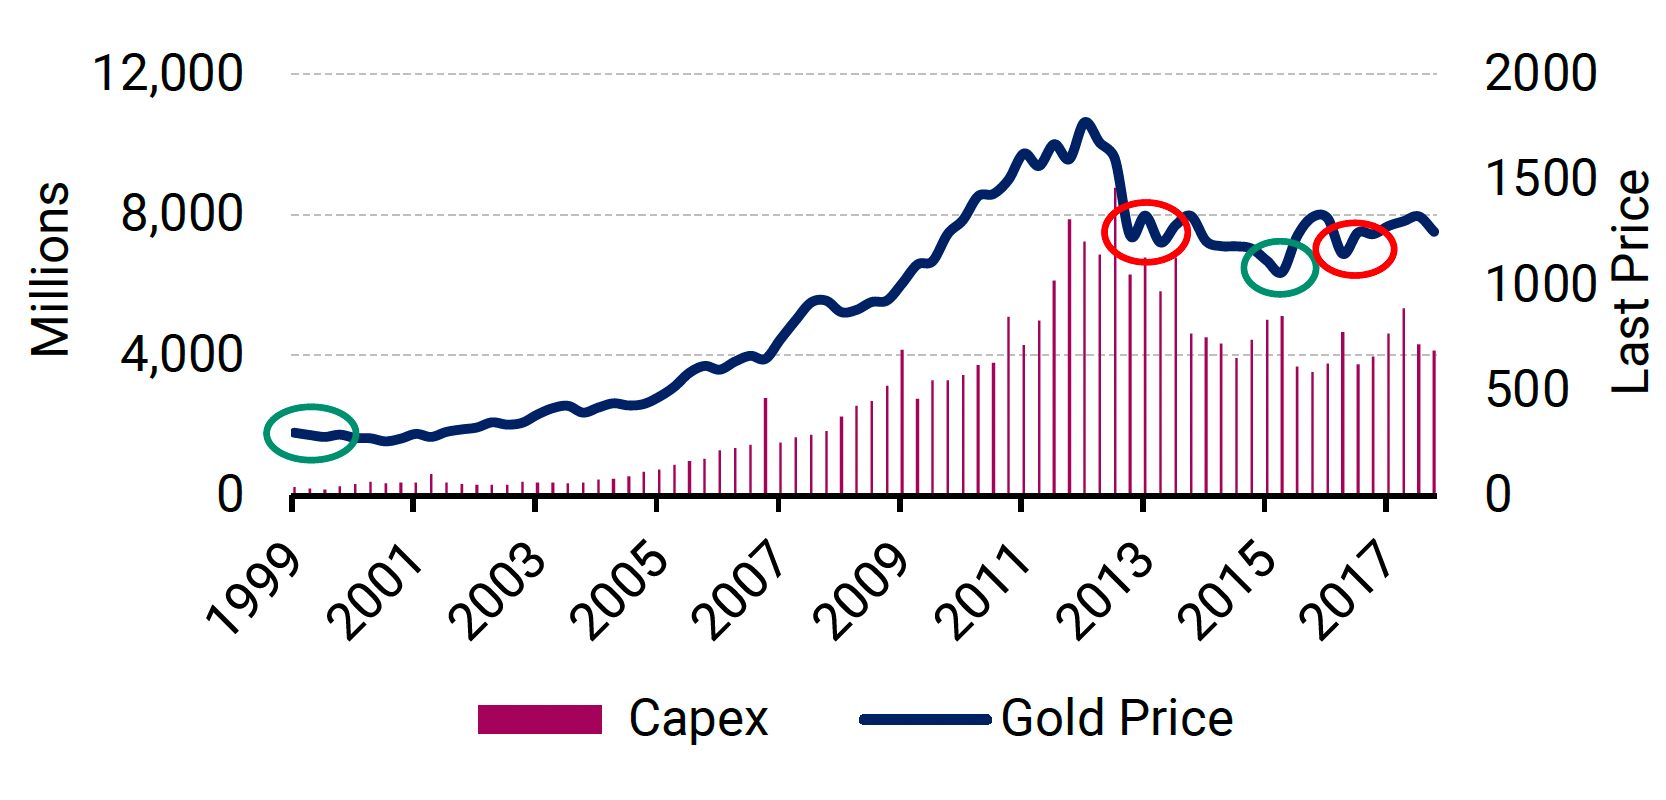
This model works for the manufacturing, mining sector and commodities as well. We can apply the same logic to understand the equity and pricing dynamics from the connections between:
Miners vs Commodity Prices
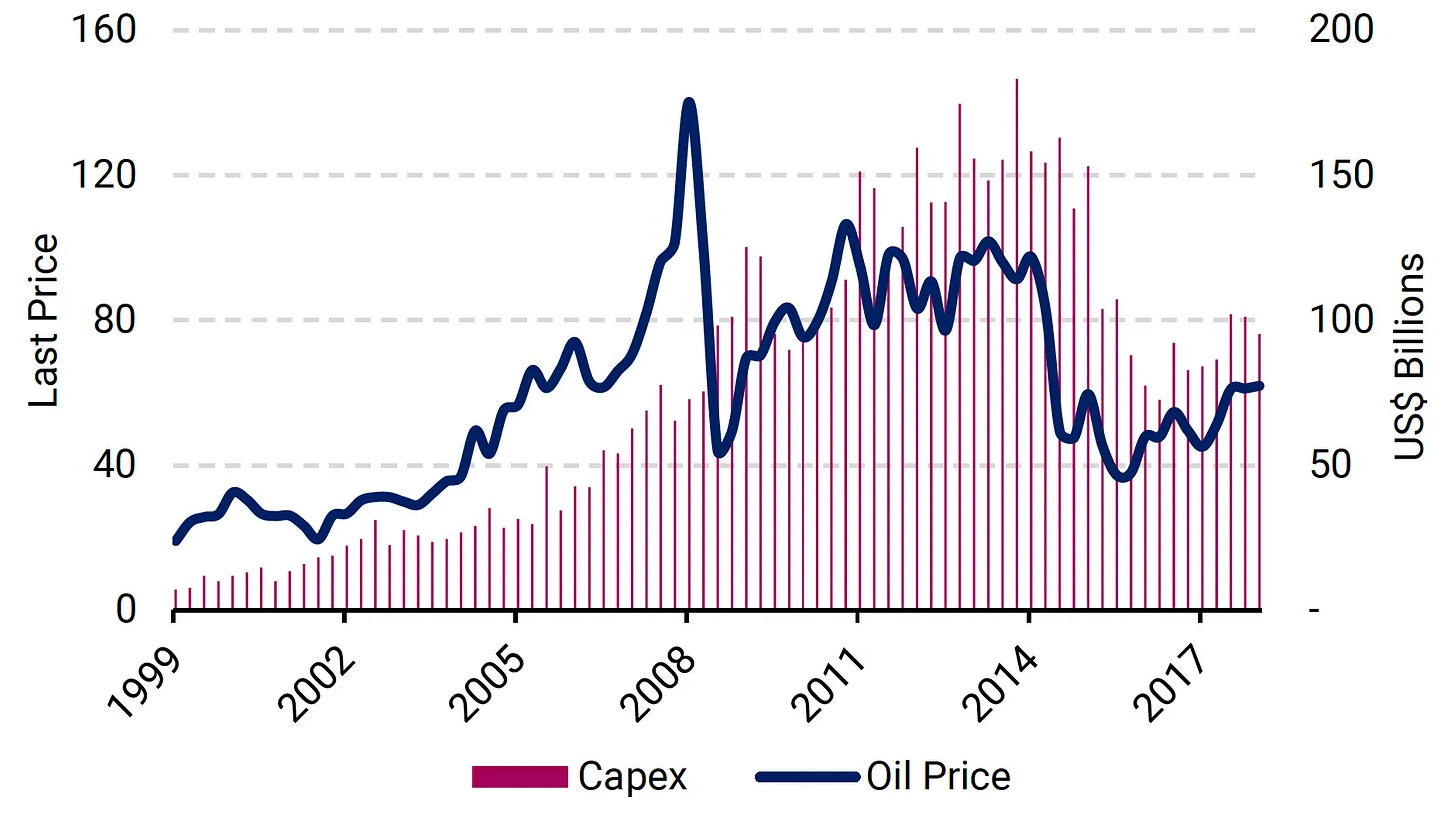
Oil Producers vs Oil Prices
REI: Time After Time
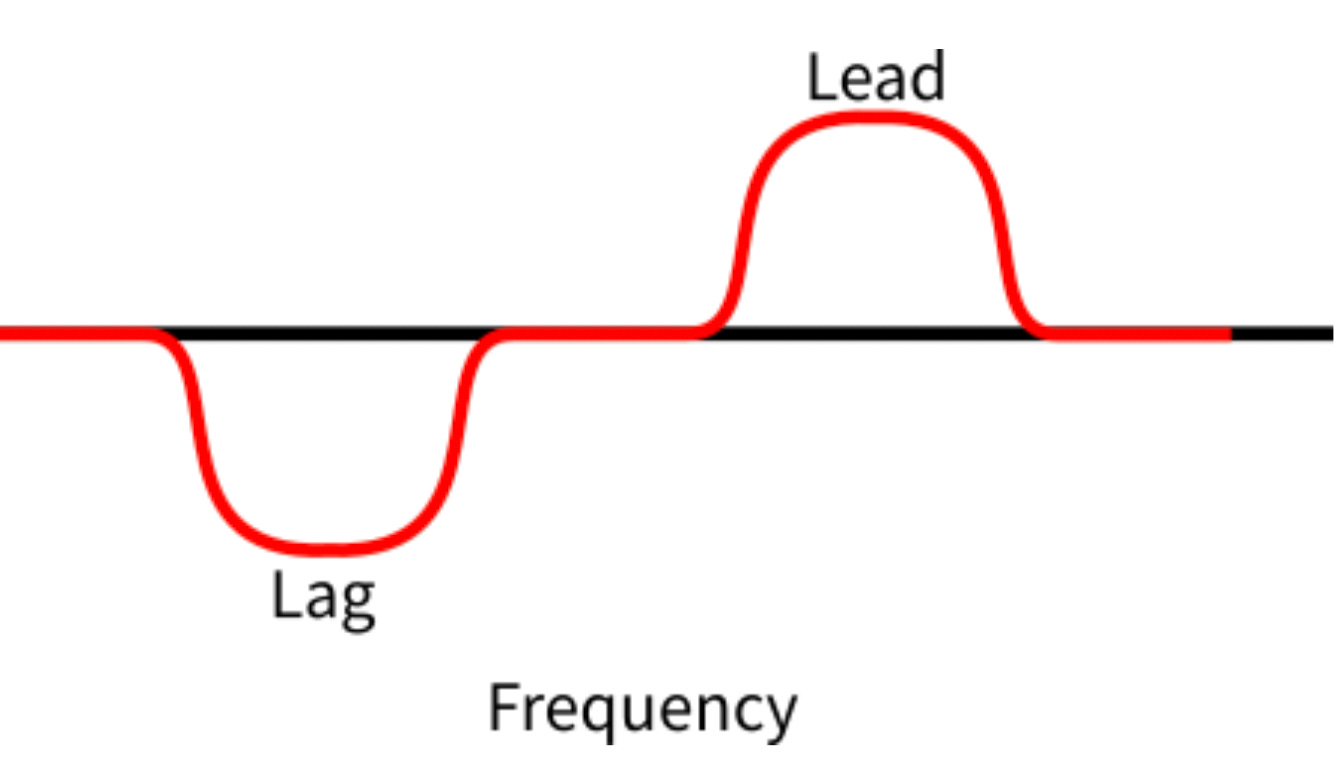
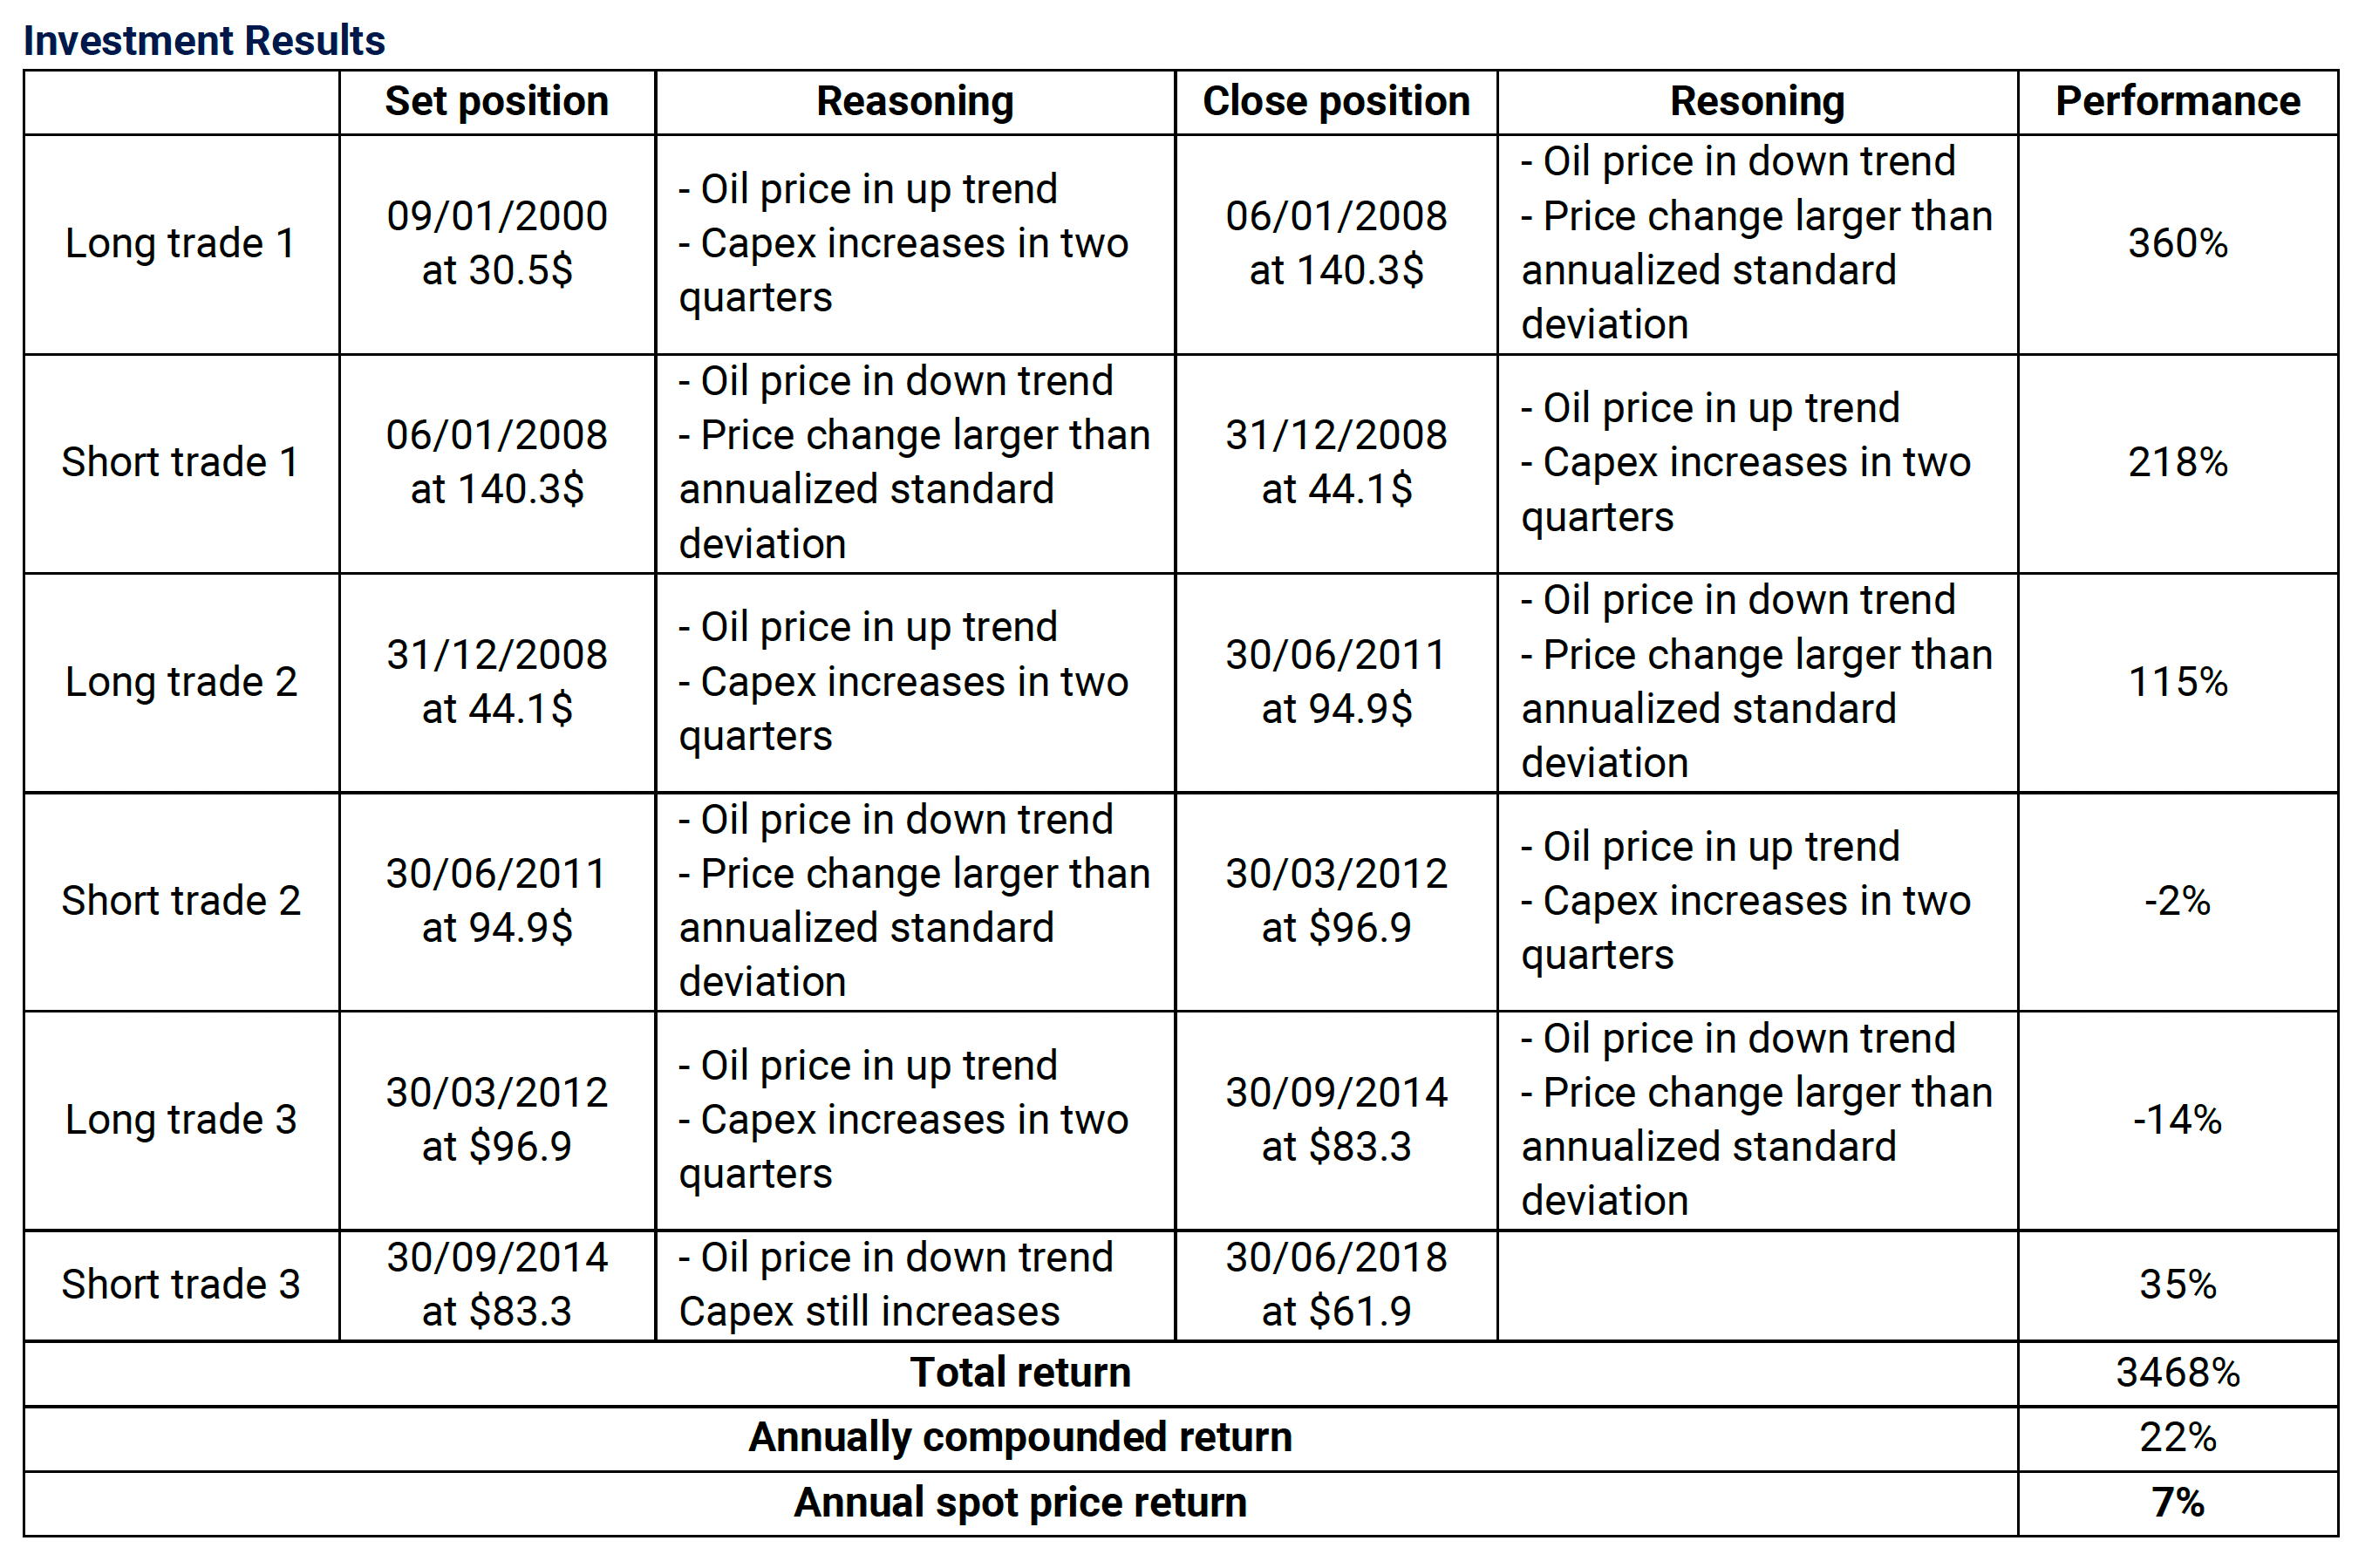
Observe this principle in action with the current detachment between oil producer share prices and oil prices. Earnings from conglomerate producers continue to remain profitable after oil prices drop, due to the lag time through the business and investment cycles.
Investors with exposure to real estate developers in addition to purely real estate holdings will receive different results. Share prices and asset prices may detach with the different lead lag times.
Global Perspectives
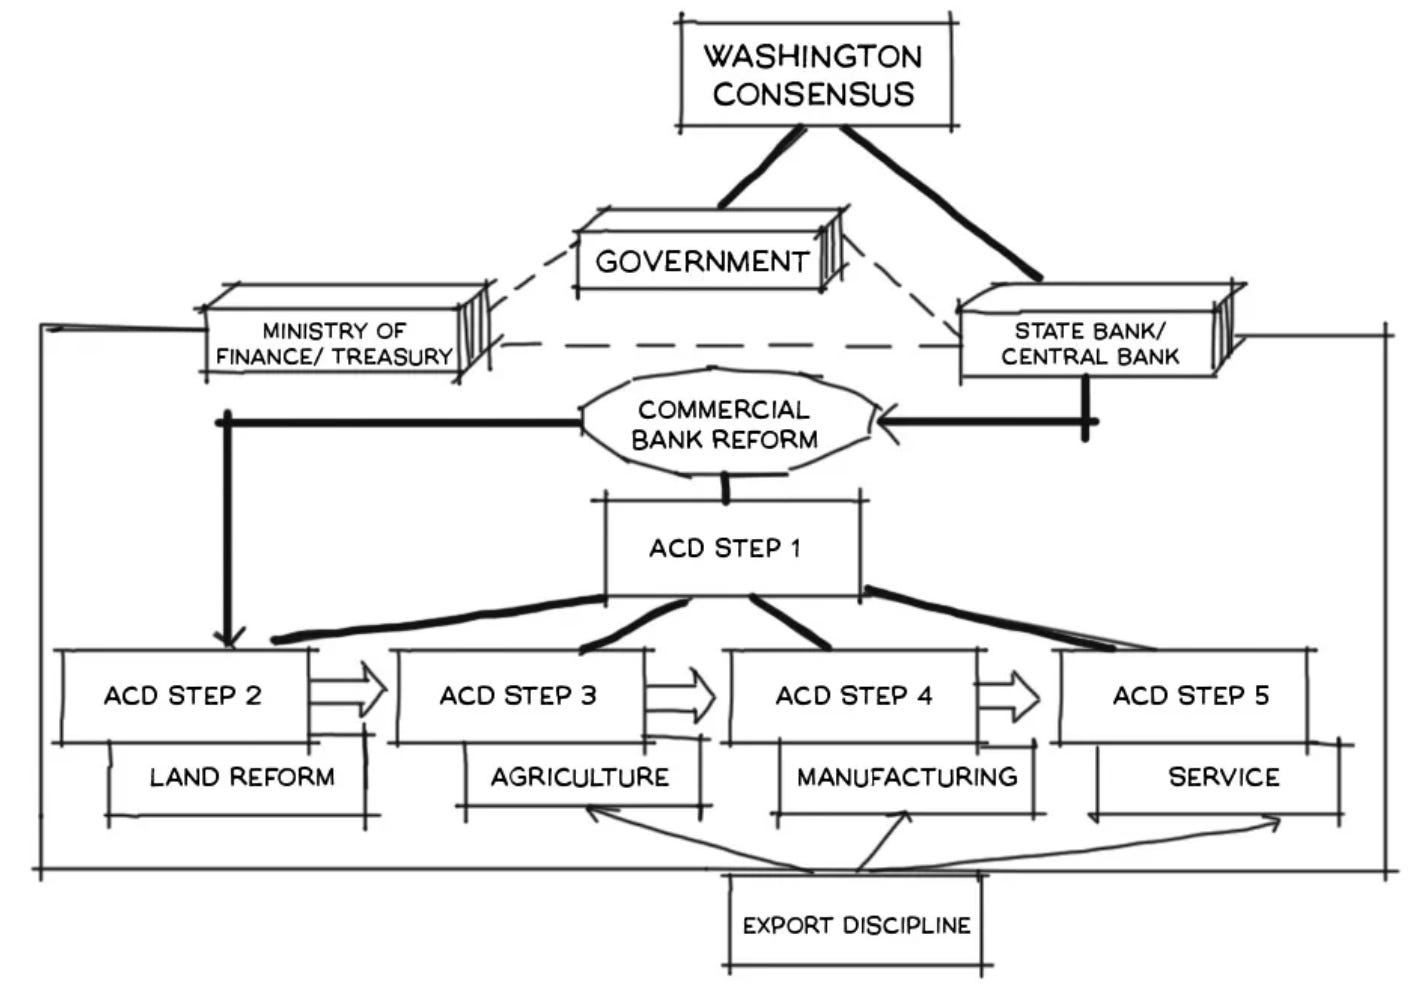
The state controls most big banks through monetary policy, and these banks control the flow of capital. The competitive rates of borrowing in relation to other debt instruments ensure that banks are the principal lenders in major markets. Land rights and taxation are regulated by the government, allowing levers of centralized control by the state.
Through this lineation, banking assets in command economies like China are mostly government-owned, whereas in Hong Kong and Singapore, two well-developed economies, governments don’t own these assets - they have interest in figures such as GDP growth.
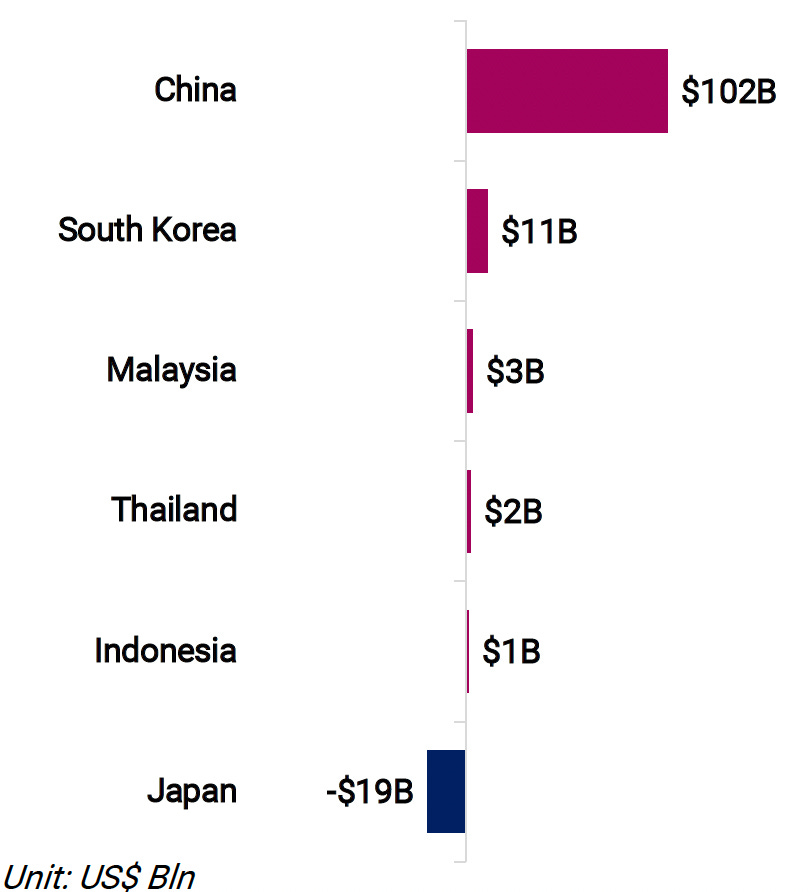
In the Asia Pacific, Japan and South Korea have the highest leverage ratios. Banks there tend to lend from 17 up to 21 times their equity, which is slightly more than that from China and Hong Kong. In Southeast Asia (especially Indonesia), banks have less leverage – with around 10.3% in principal requirements, which is on par with the rest of the world.
Banks with high leverage are expected to have high quality assets, because otherwise, banks would experience losses from risky loans that cannot be serviced. Non-Performing Loans (NPLs) are loans, with its interest, that cannot be serviced. Since 2011, the number of NPLs in China and Hong Kong have sky-rocketed.
REI observes loans relative to credit with national lending rules and regulations. If banks have lower the equity relative to assets, then the amount they lend out (compared to their assets) becomes higher.
Let’s say 10 percent of a bank’s total assets are equity (as you might find in Hong Kong, Singapore, Thailand and Malaysia). If the amount of bad debt increases by 1% (like in China and Hong Kong), then 10% of the bank’s equity is gone. For Chinese, Japanese and South Korean banks, who have more leverage, a 1% increase in NPLs would be more damaging.
Even in Western markets, such as the UK, Australia or Canada, bank balance sheets have a heavy emphasis on property and exposure to the leverage risks currently being addressed in Basel III and IV. These real estate centric economies are a result of a smaller stock market size relative to GDP.
The scale of the equity markets in the US economy means that real estate plays a lesser role in overall GDP. Although the same risks from NPLs exist on bank balance sheets.
Q4 2022
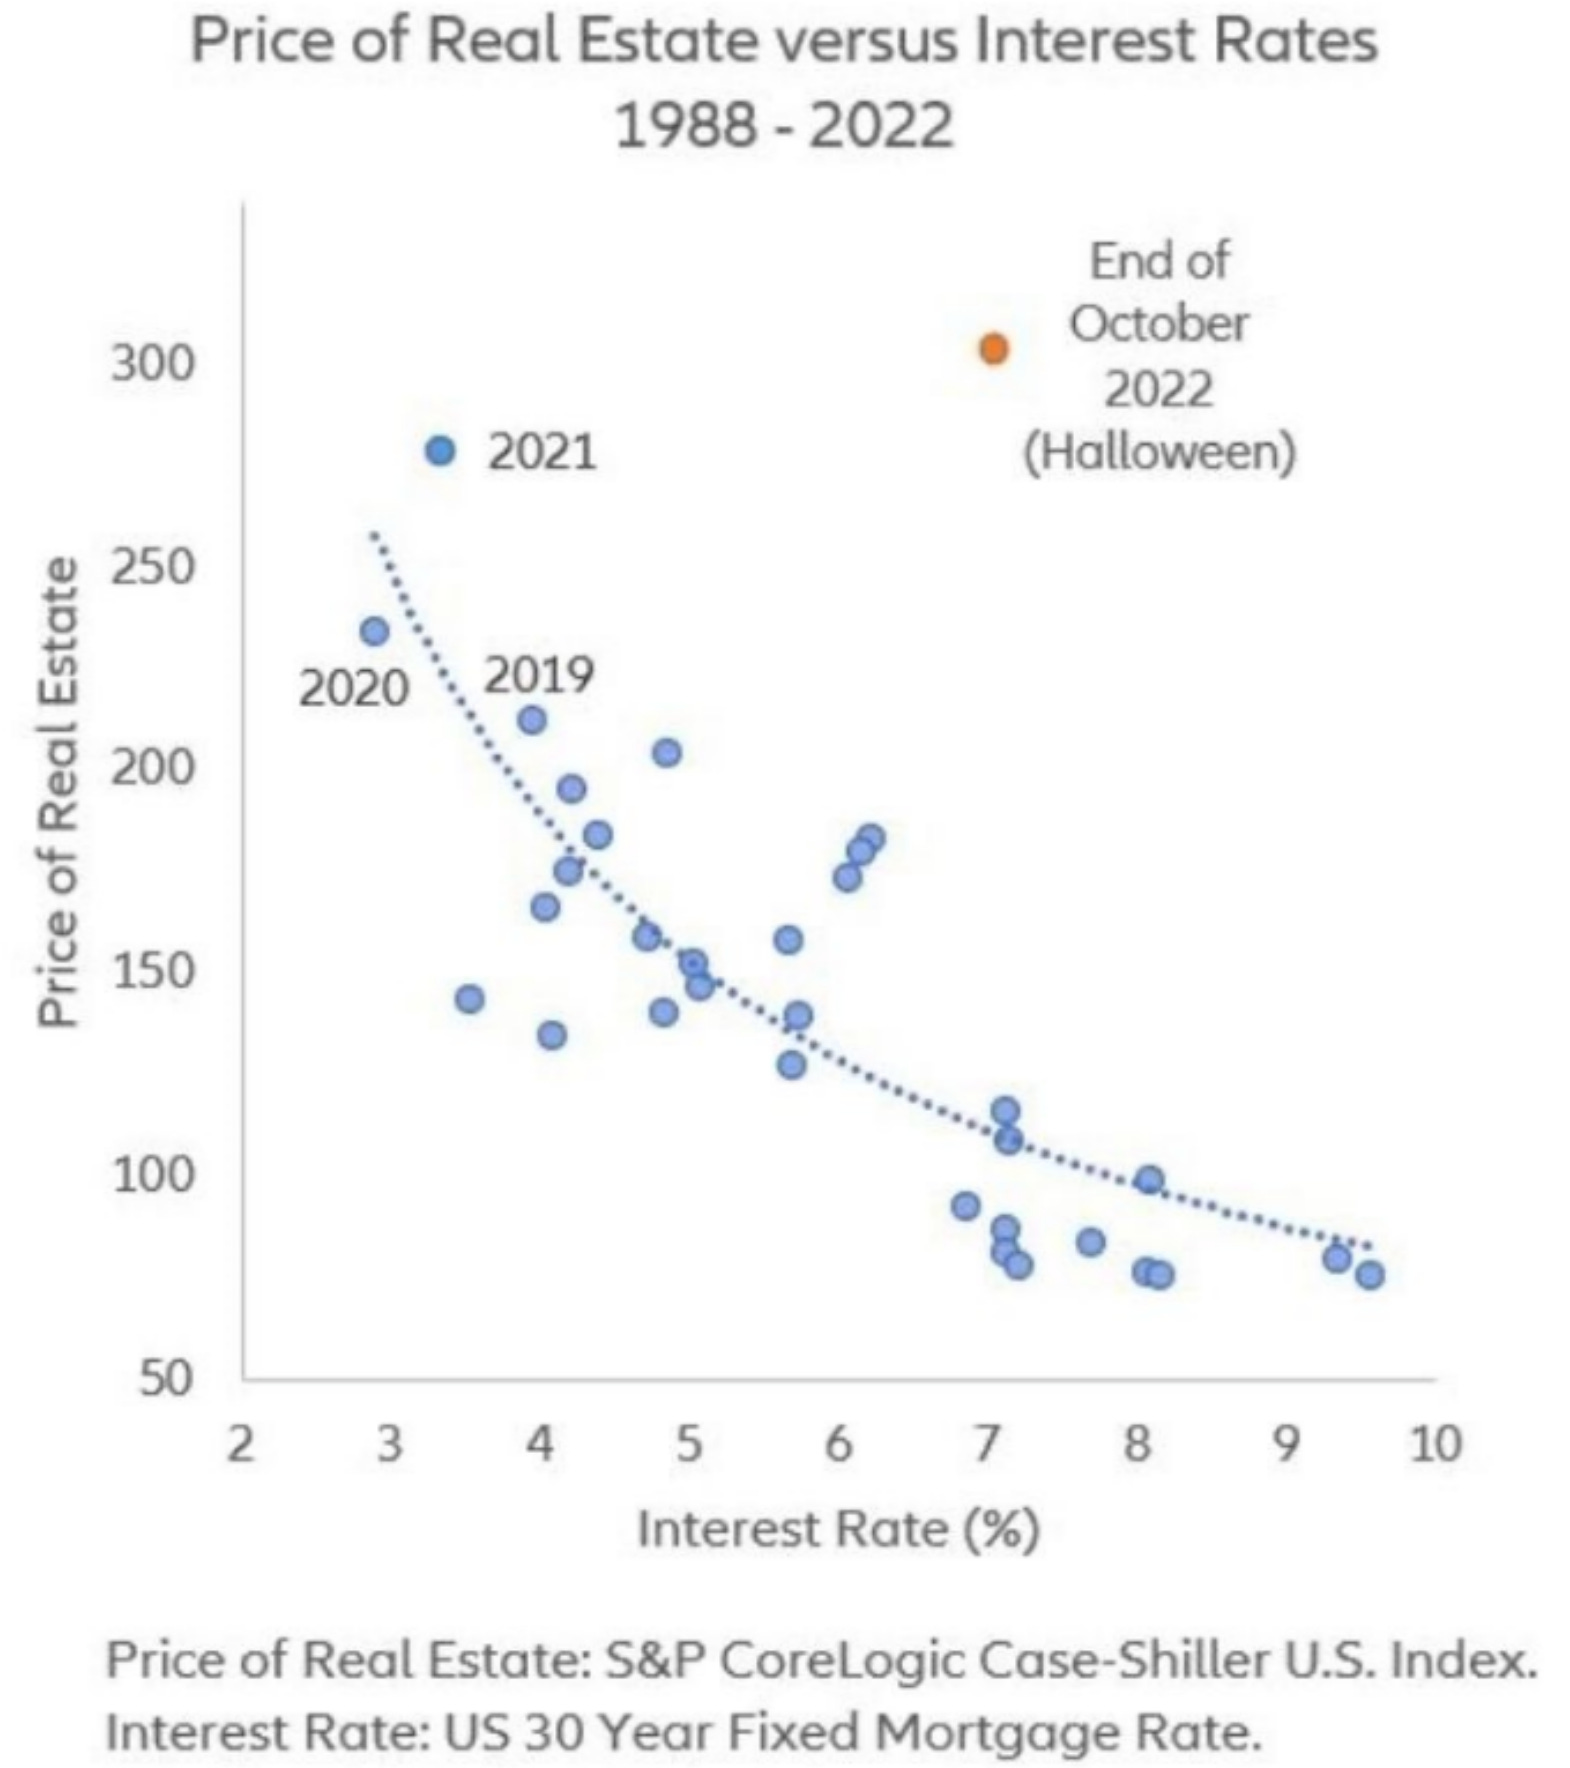
It was using the REI approach that gave us the cues for the coming real estate decline. By identifying the increasing disparity between real assets and financialized assets of the mind, back in March 2021 Stock Market Alchemy
Individual markets are at different stages in their national economies, despite major global trends. Many developed markets are now beginning to tighten as prices are overvalued. Central and commercial banks are emphasizing an orderly cooling off to preserve their own balance sheets. Any sudden moves from stakeholders in the industry will cause an avalanche of exponential reactions.
Opportunities are still to be found in emerging markets, if taking a comprehensive look at the factors and value chain. The other aspect to consider is currency arbitrage when assessing multi jurisdiction advantages.
USD is the haven of choice for those exiting real estate. We give an introduction in the following video. We’ll be publishing another piece soon, that breaks down the logic behind King Dollar’s steps.
We work with fund managers to determine the optimal (re)deployment of capital with a 360* review to minimize losses from real estate and maximize gains from exposure with accurate risk/reward ratios.
Please hit reply. We look forward to hearing from you.